InstrumentsのTime Profilerで自分のコードにフィルターする
InstrumentsのTime Profilerで重い処理の特定に困っていませんか? 今回の記事はInstrumentsにてフィルターを設定して自分のコードのみを表示する方法を解説します。


InstrumentsのTime Profilerで重い処理の特定に困っていませんか?
今回の記事はInstrumentsにてフィルターを設定して自分のコードのみを表示する方法を解説します。
try! Swift 三日目
try! Swift3日目。Testing and Performance Workshopに行ってきました。
そこでInstrumentsの使い方を教わり、感動したので共有します。
ワークショップのURLはこちらです。
https://www.tryswift.co/events/2019/tokyo/jp/#testing-and-performance
Time Profilerとは
Instrumentsのテンプレートの一つで、コードの実行時間を計測します。
時間がかかっている処理をみることができ、コードを修正する指針とすることができます。
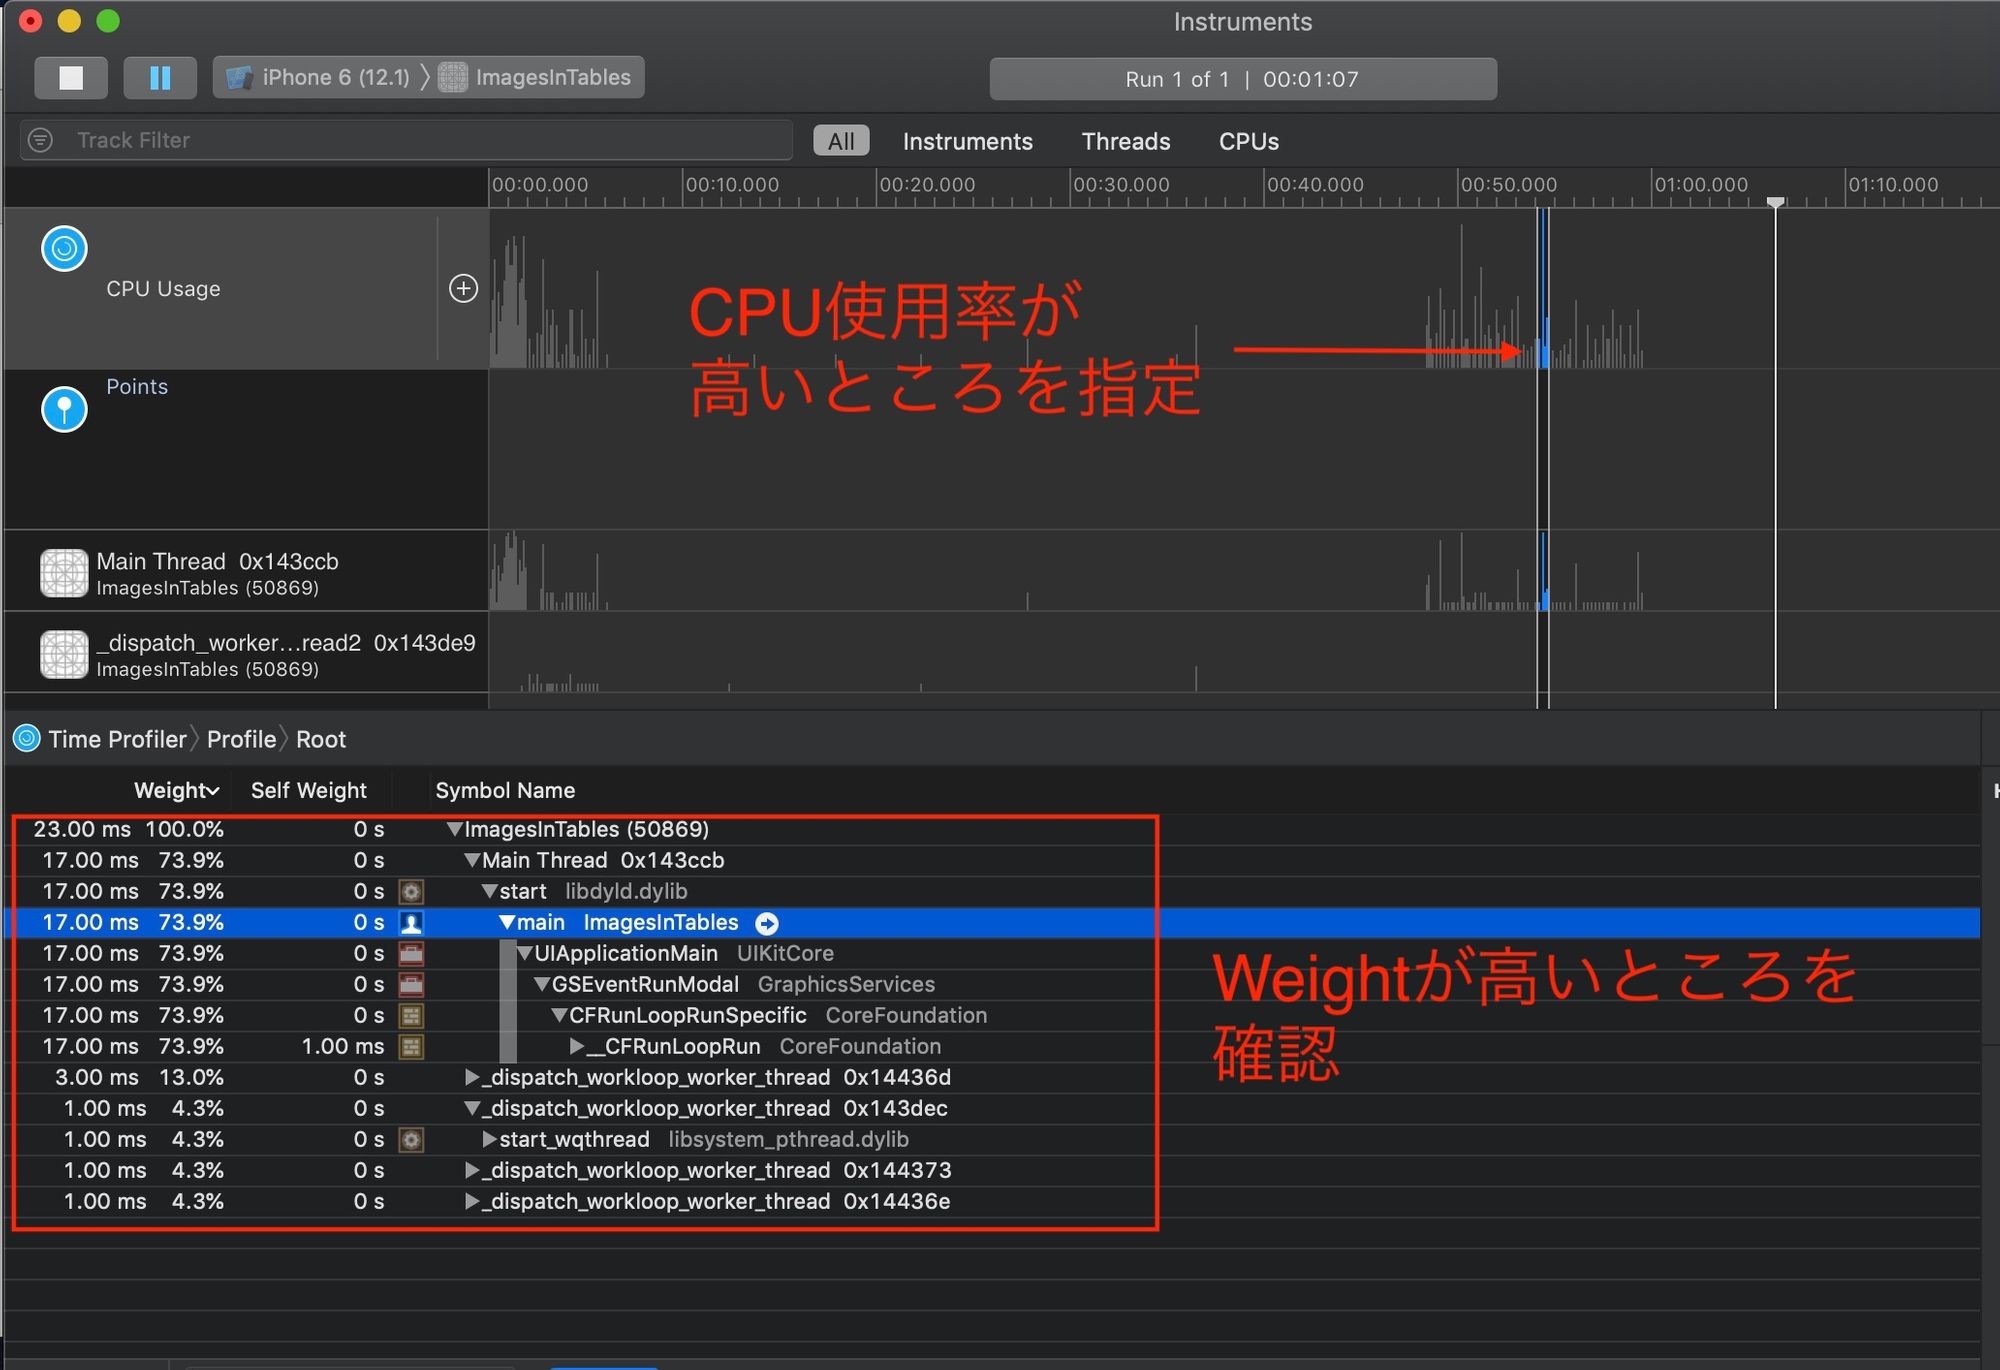
さて便利なツールなのですが、このままではシステム処理も一覧にでてきてしまいます。
上記図のGSEventRunModal以下などです。
自分のコードを確認確認するにはたくさんの階層を下がっていく必要があり見つけることが大変です。
早くみつかる方法がないかと思いつつ地道に階層を展開していました。
自分のコードをソートする
ところが!なんとシステム処理を省いて、自分のソードをソートすることができるのだそうです!
やり方は簡単。
画面下のCall TreeボタンをクリックしてHide System Librariesにチェックをいれるだけ!
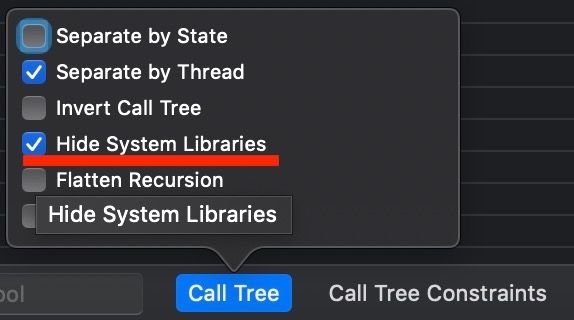
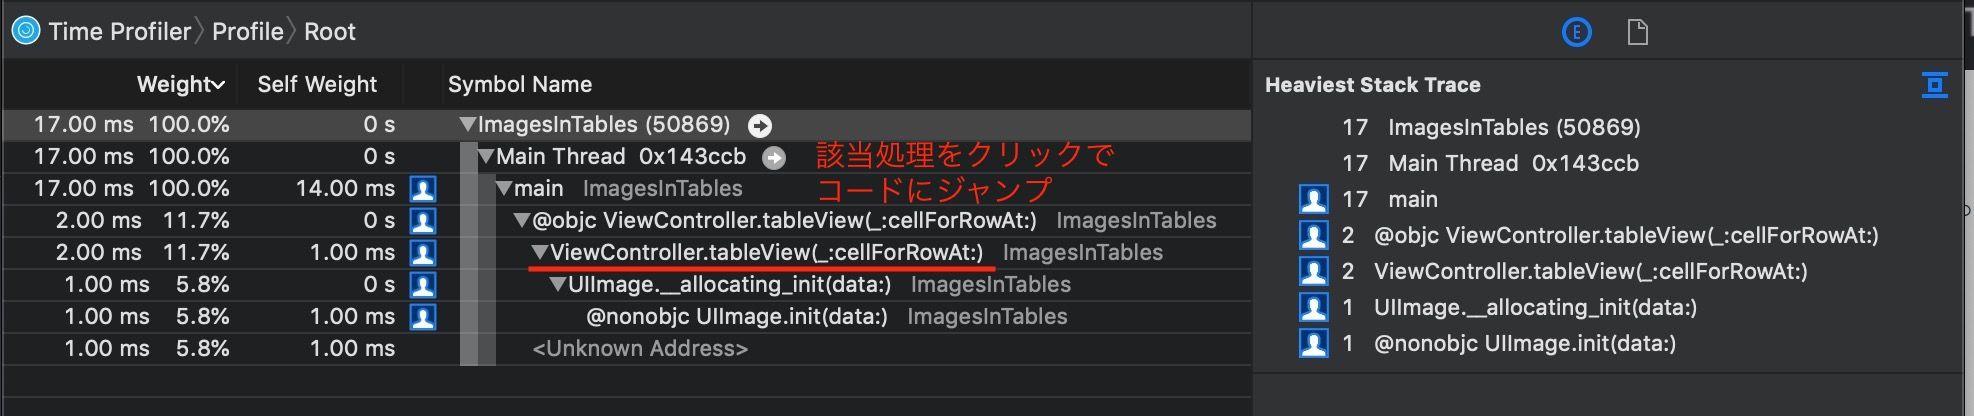
するとシステム処理が省かれて、自分が実装したコードのみが表示されます。
ViewController.tableView(_:cellForRowAt:)
が1.00msかかっていますね。
この行をクリックすると実際のコードにジャンプできます。
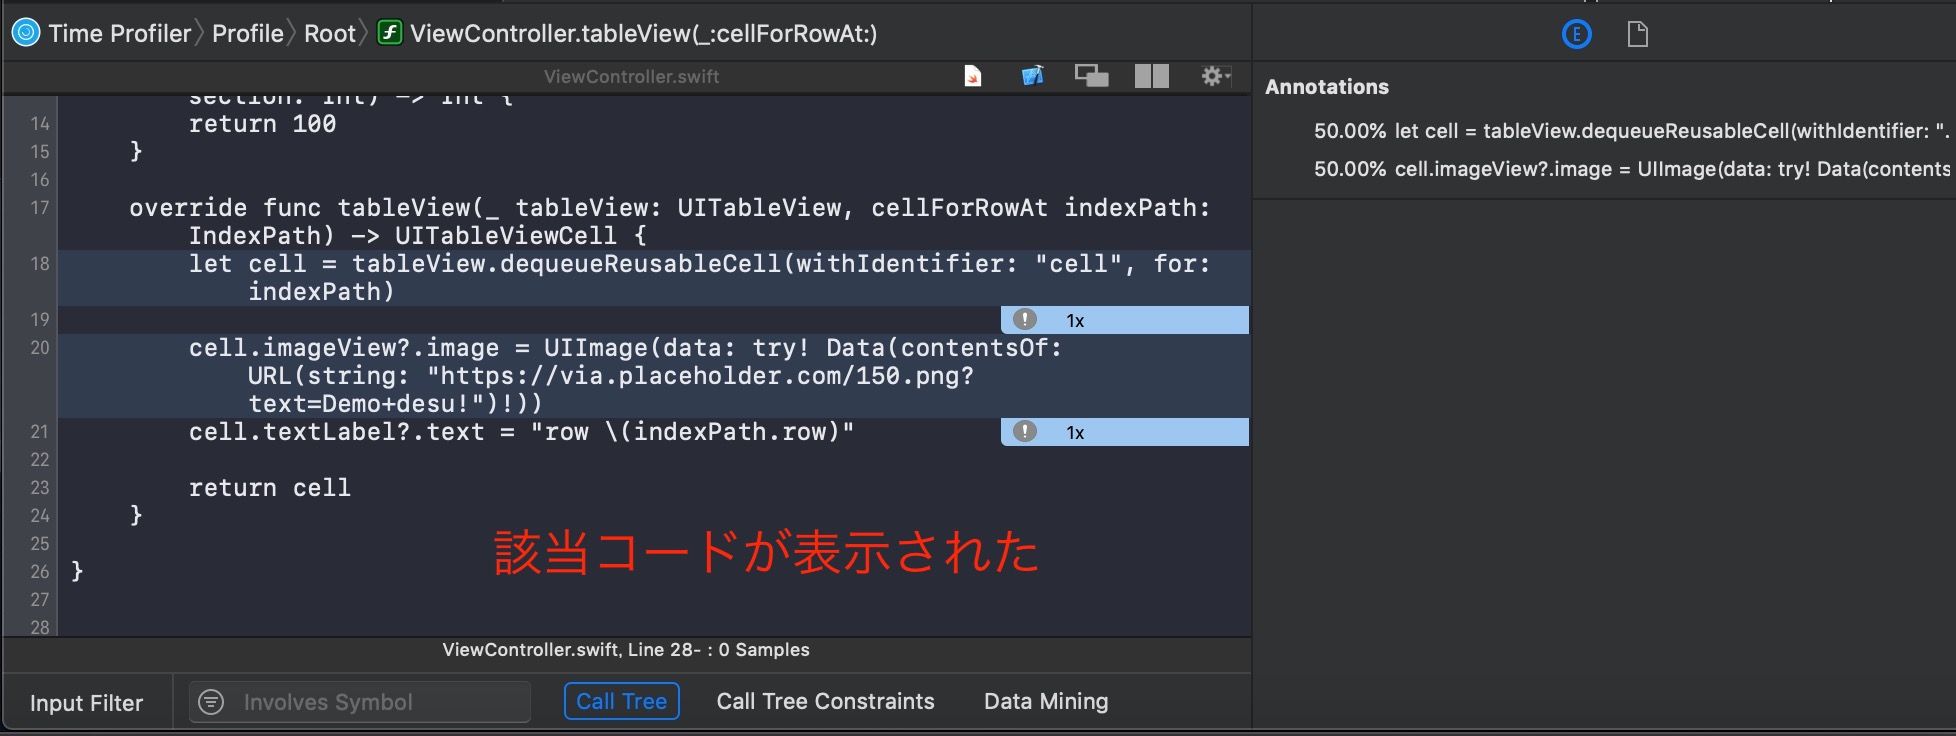
該当コードが表示されます。
    override func tableView(_ tableView: UITableView, cellForRowAt indexPath: IndexPath) -> UITableViewCell {
        let cell = tableView.dequeueReusableCell(withIdentifier: "cell", for: indexPath)
        // Mainスレッドで通信している 😅
        cell.imageView?.image = UIImage(data: try! Data(contentsOf: URL(string: "https://via.placeholder.com/150.png?text=Demo+desu!")!))
        cell.textLabel?.text = "row \(indexPath.row)"

        return cell
    }
cell.imageView?.image = UIImage(data: try! Data(contentsOf: URL(string: "https://via.placeholder.com/150.png?text=Demo+desu!")!))
で毎回通信して画像を取得していますね\(^o^)/
ここがおかしいことがわかりました。
通信をバックグラウンドで実行するなど、パフォーマンス向上の処理が必要ですね。
まとめ
Call TreeボタンをクリックしてHide System Librariesをすると、システム処理が省かれて調査がはかどります。
皆さんもぜひしてください!